Milk Production Over Time
DairyComp
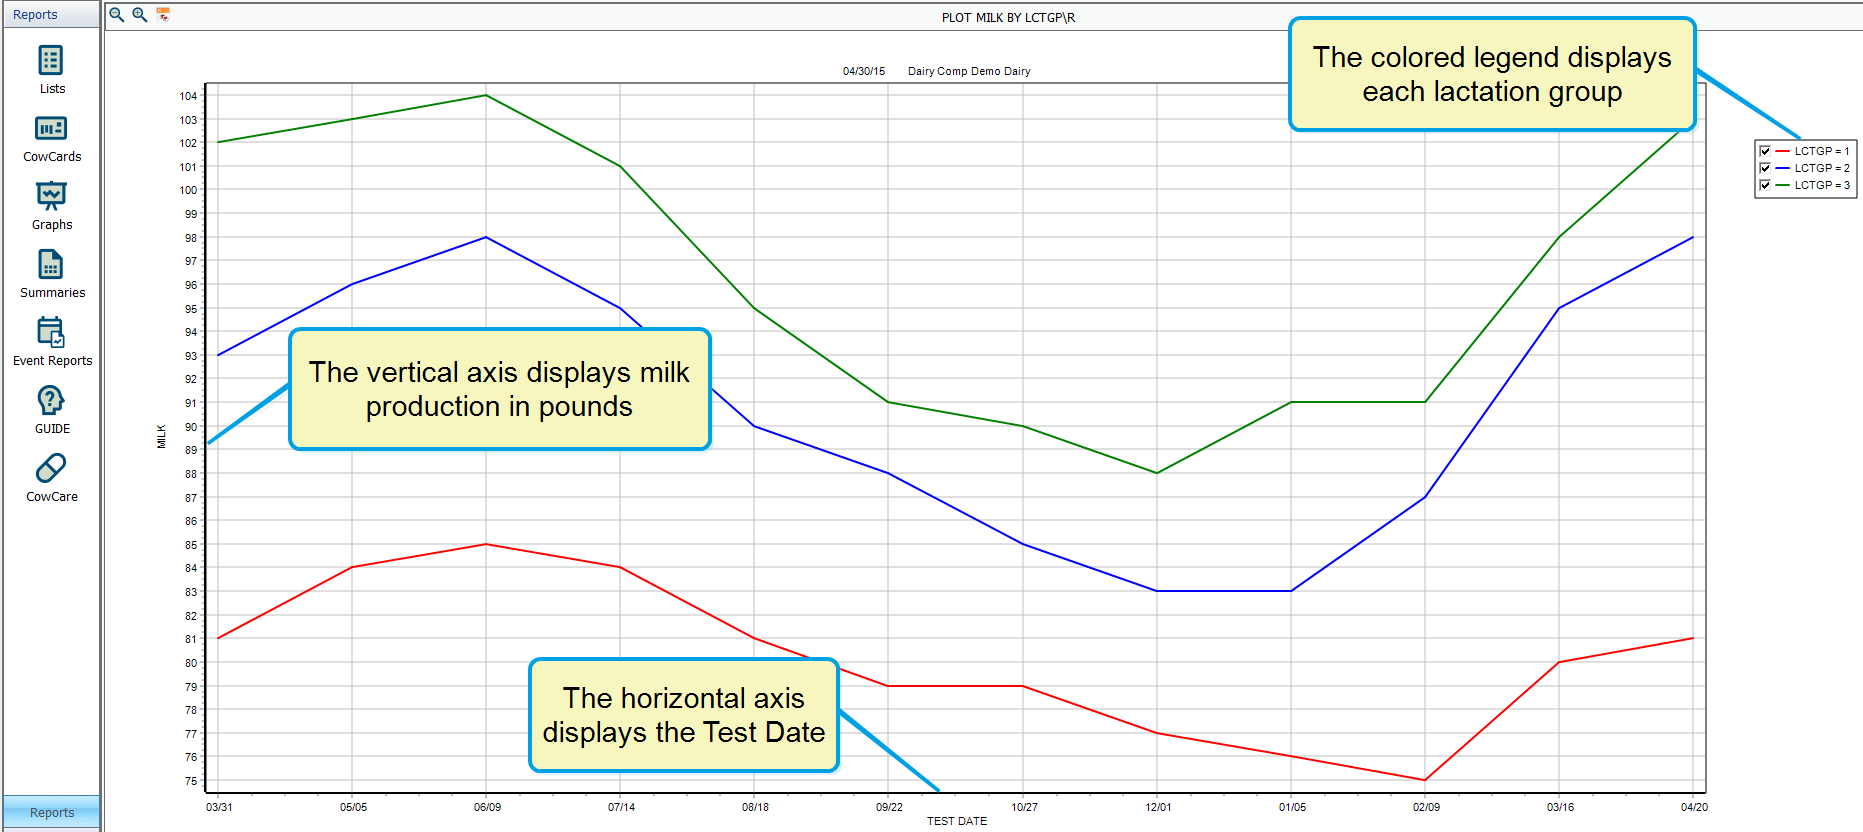
The PLOT MILK BY LCTGP\R command displays a chart that plots the average daily milk by lactation group.
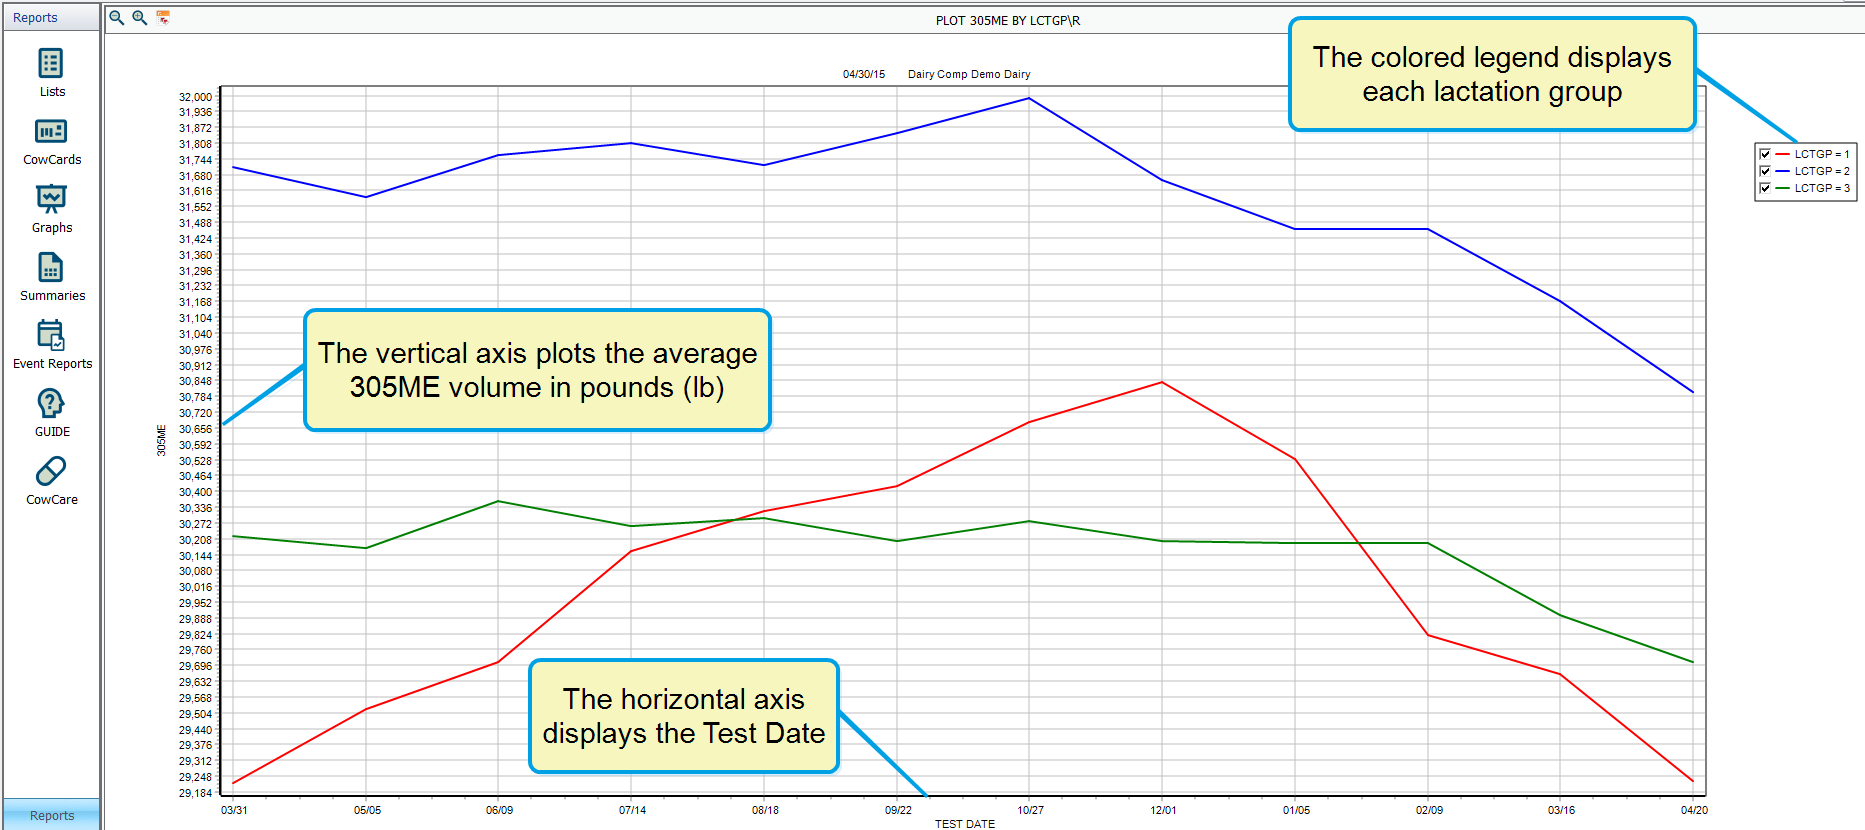
The PLOT 305ME BY LCTGP\R command displays a chart that plots the average 305 day mature equivalent by lactation group.
The GRAPH MILK BY DIM LCTGP command displays a scatter graph of the current daily milk production and DIM for all cows currently in production.
